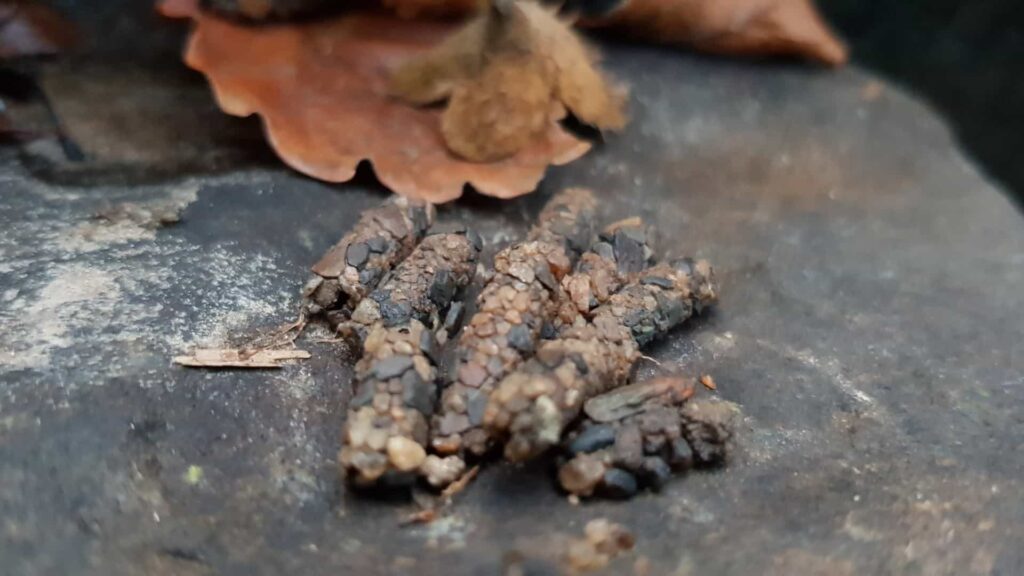
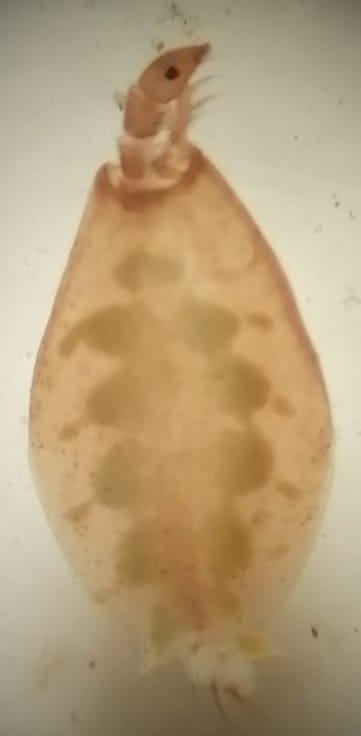
Part of my role as Monitoring Officer is collecting and identifying invertebrates which live in the catchment’s rivers. Many of these are insects, such as stoneflies and mayflies, which emerge from the water to live on land. They are important indicators and the species/family and number found helps us to understand the water quality, as some can only survive in clean water, whilst others can flourish in quite polluted water.
Invertebrates are collected by kicking at the river bed to disturb the sediment where they live. They then flow into a net held just downstream. I then identify them, using a microscope, to species/family level and record what I find. I analyse the results using water quality indices, which tell me how degraded a site is, how sedimented the water is and indicate the quality of habitats.I survey the same 24 sites each summer to monitor any changes in quality and the results complement fisheries monitoring which takes place at the same sites. The sites are split into sub-catchments to give a more localised overview.
In 2020 I identified almost 15,000 individuals from the 24 sites, which is fewer than 2019 when I found over 16,500.

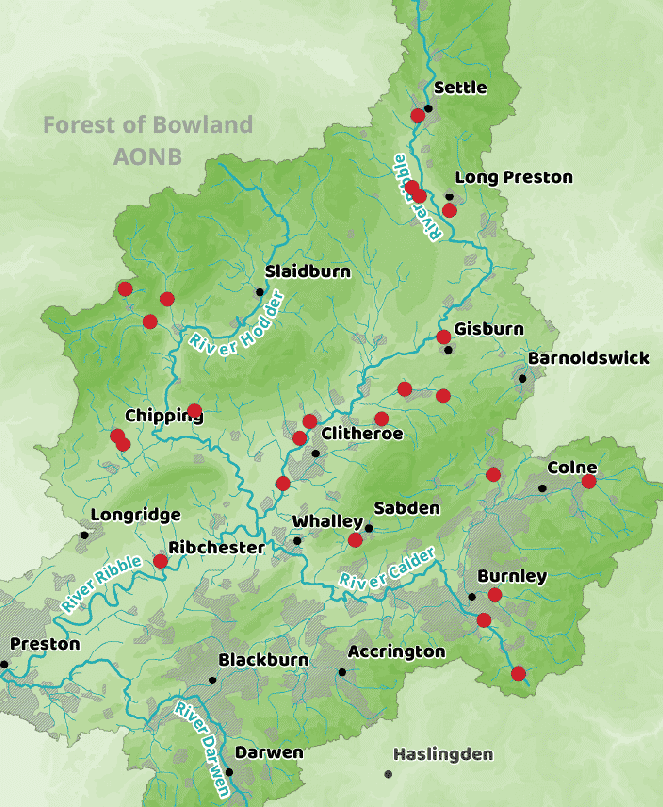
In 2020 Mid-Ribble sites scored well in most metrics, including the highest mean number of individuals (877) and Swanside Beck had the most (1367). Stock Beck had the most different families (35) and the second highest WHPT score, indicating lower levels of degradation.
The Hodder performed poorly, with the lowest number of individuals (360) and scores suggest a general degradation at several sites. However, it was found to be the least sedimented sub-catchment and both Chipping Brook sites were the least sedimented.
The Calder showed a huge decline in the number of individuals and showed a slight increase in sedimentation but for all other indices there was a slight improvement. Swinden Water had the second highest number of individuals (1308) and Sabden Brook had a high ASPT (average score per taxon/family).
Upper Ribble scored very well, although it does show signs of sedimentation. It had the most different families (34) and the least degradation, but showed the highest sedimentation.
A detailed report of findings will be published on the RRT website in the new year. Annual monitoring will continue to assess changes to habitat and water quality and the results will support decisions about remediation work.